









Summary: Infrastructure modernization projects consistently lose the internal capital allocation argument because the evaluation model is incomplete. Simple payback ignores the true cost of inaction: the compounding energy spend on aging equipment, the growing probability of an unplanned failure event, and the replacement cost premium that makes the same project more expensive every quarter it is deferred. When those costs are included in the model, the IRR of proactive modernization improves substantially. This post explains what the standard model is missing and how finance leaders are reframing the total cost of ownership calculation to make the case for acting now.
Introduction
If you manage capital allocation for a large industrial organization, you have seen this dynamic play out. A facilities or operations team submits a request to replace aging infrastructure. The capital framework evaluates it against a standard payback threshold, often three years, and the project does not clear the hurdle. It loses the comparison to a production expansion, a technology investment, or almost any project with a cleaner return profile. The infrastructure request goes back into the backlog. The equipment keeps running.
This happens at most large industrial organizations, repeatedly, across every budget cycle. And it is not because finance leaders are making bad decisions. It is because the model they are using to evaluate infrastructure is missing a significant portion of the cost.
Simple payback measures the return on investment. It does not measure the cost of not investing. For infrastructure modernization, those are not the same calculation and the gap between them is where the real financial case lives.
The model problem
Why does infrastructure keep losing the capital allocation argument?
Simple payback is a reasonable model for evaluating growth investments. It works when the alternative to investing is a neutral baseline — when not building the new production line simply means not having that capacity. But facility infrastructure does not have a neutral baseline. The alternative to replacing aging equipment is not the status quo. It is a deteriorating status quo with a growing and compounding cost. That cost has three components, each compounding independently: rising energy cost on aging equipment, accumulating failure risk, and a replacement project that grows more expensive over time.
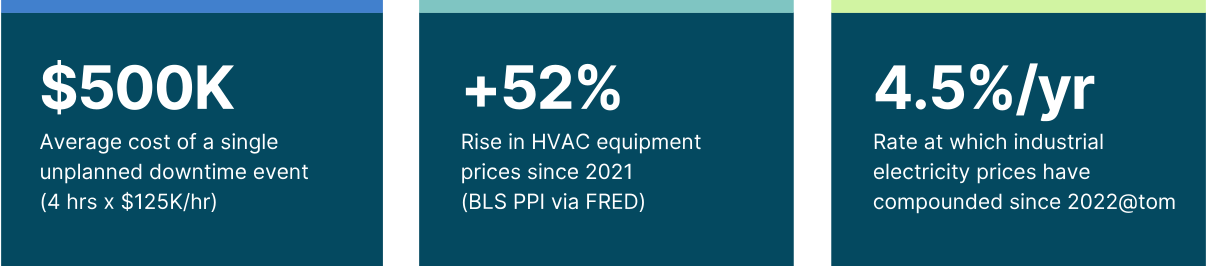
The first is energy cost on degrading equipment. HVAC and mechanical systems approaching 20 years of service operate at 25 to 40 percent below their original efficiency ratings. At the same time, electricity prices have risen at an average of 4.5 percent per year since 2022, more than six times the pre-2022 rate. These compound together: less efficient equipment running on an escalating energy baseline.
The second is failure risk. Over 60 percent of unplanned industrial failures are caused by aging assets and mechanical failures. The average unplanned downtime event lasts four hours at a cost of $125,000 per hour. That is a $500,000 exposure that does not appear in any capital request, because it has not happened yet. But its probability increases every year the equipment is not replaced.
The third is the replacement cost premium. The BLS Producer Price Index for HVAC and Commercial Refrigeration Equipment reached an all-time high of 235.3 in April 2026, up approximately 52 percent since early 2021. Major manufacturers have announced price increases of 4 to 14 percent annually since 2021. Every quarter the project is deferred, the capital required to execute it grows.
None of these costs appear in the simple payback model.
Consider how this plays out in practice. A mechanical system replacement evaluated on energy savings alone might show a six- to seven-year simple payback, well beyond the three-year threshold most capital frameworks apply. On that basis, it is declined. Every time. But energy savings were never the whole return.
Research on the multiple benefits of industrial energy efficiency, led by the Fraunhofer Institute and the IEA, has found that non-energy benefits such as avoided failures, reduced maintenance, and productivity and reliability gains are typically worth 40 to 50 percent of the energy savings value, and in some cases more than double it. When those benefits are included, paybacks compress sharply. The IEA documented cases where a four-year payback dropped to one year once the full value was counted.
Two Models, Same Project
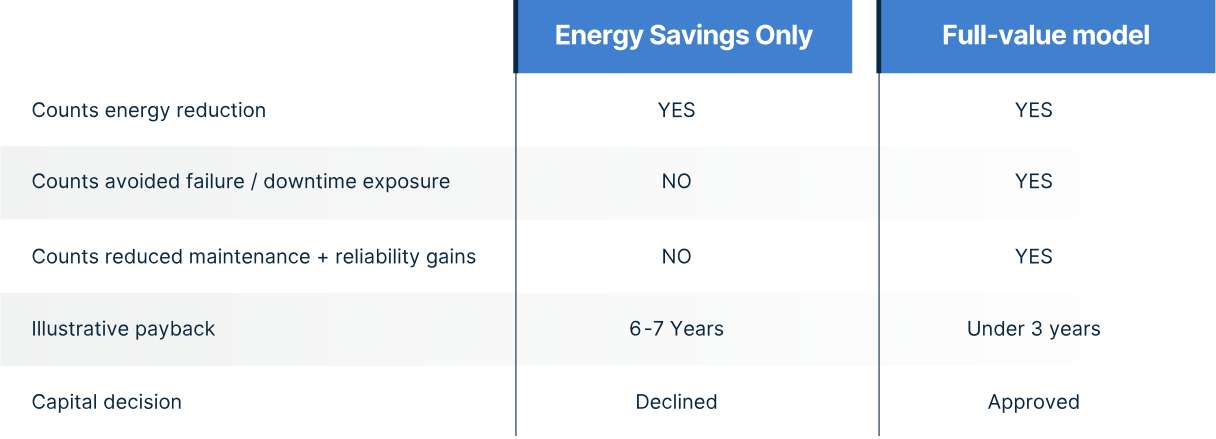
The project did not change. The model did. The same replacement that failed on energy-only payback clears the threshold comfortably once the cost of inaction and the non-energy benefits are counted.
They accumulate in operating budgets, emergency maintenance lines, and eventual replacement programs. By that point, the organization has paid the compounding cost of deferral in full, plus a premium for acting in reactive mode rather than on a planned schedule.
Infrastructure projects keep losing the capital argument because the model omits the cost of not acting.
The total cost of ownership calculation
How do finance leaders reframe the infrastructure investment case?
The reframe is straightforward, but it requires changing the question. Instead of asking what the project costs and how quickly it pays back, the model needs to ask what the organization is currently paying to defer it and how that cost changes over time.
Total cost of ownership for aging infrastructure includes the ongoing energy inefficiency cost, the probability-weighted cost of an unplanned failure event, and the replacement cost premium that grows with every year of deferral. When those are modeled explicitly, the IRR of proactive modernization improves substantially because the denominator of the calculation is not zero. It is a compounding liability.
The marginal cost of deferring is the most useful framing for a capital allocation conversation. The question is not whether to invest in the project. It is what the growing exposure will cost when it is finally forced, at emergency replacement prices rather than planned ones. That framing converts an infrastructure request from a capital expenditure decision into a risk management decision, one that finance leaders are equipped to evaluate against the same criteria they apply to any other material financial exposure.
The real question is not what the project costs today. It is how much the growing exposure will cost when it forces an emergency replacement instead of a planned one.
What the Reframe Delivers
What do finance leaders gain from proactively replacing aging systems?
The financial case for proactive modernization has three layers, in order of how a finance leader should think about them.
The first is cost reduction. Replacing aging infrastructure with modern, high-efficiency systems lowers energy spend, eliminates escalating repair costs, and removes the unplanned failure exposure from the operating budget. These are measurable, verifiable savings that show up in the P&L. DOE’s Operations and Maintenance Best Practices Guide documents that moving from a reactive maintenance posture to a planned, predictive one can reduce operations and maintenance costs by more than 30 to 40 percent, before counting the energy savings from higher-efficiency equipment.
The second, and more strategically significant, is predictability. A proactive portfolio program converts energy and maintenance spend from a volatile, event-driven cost into a forecastable one. Unplanned events stop setting the budget. The finance team can model infrastructure costs with confidence rather than absorbing surprises that require emergency budget reallocation.
The third is capital efficiency. Infrastructure modernization funded without competing with core business investment means production capital, technology investment, and growth projects are not displaced. The program pays for itself through the savings it generates and the capital that was quietly being consumed by reactive maintenance gets redeployed to higher-return uses.
There is a fourth consideration, and for many finance leaders it is the one that changes the timeline. The first three are about cost. This one is about revenue. When aging infrastructure degrades to the point that it constrains capacity, a production line that cannot hold tolerance, a distribution facility that cannot maintain cold chain, a system that cannot meet a service level commitment, the exposure is no longer an operating expense. It is lost output, missed commitments, and at the extreme, lost customers. A cost overrun is absorbed. A revenue shortfall is not. That is the exposure that moves an infrastructure decision from the backlog to the top of the list.
Savings is the floor. Predictability is the ceiling. Protecting revenue is what makes the whole structure worth building
Why the portfolio scale changes the math
How does a portfolio approach improve the financial case for infrastructure modernization?
A site-by-site evaluation on simple payback is what keeps infrastructure projects unfunded. Each project is evaluated in isolation, without the compounding cost context, and loses the comparison to projects with cleaner return profiles. The backlog grows. The liability compounds.
A portfolio approach changes the evaluation entirely. Assessing infrastructure conditions across the full footprint makes the aggregate financial exposure visible for the first time: the total energy inefficiency cost, the cumulative failure risk, and the replacement cost premium that is accumulating across every deferred site. At that scale, the financial case is not marginal. It is substantial.
Portfolio-scale execution also compresses the timeline for value realization. Rather than sequencing projects one site at a time over years, a coordinated program captures savings across multiple facilities simultaneously. The constraint on that speed was never only capital; it was delivery capacity, the number of projects an organization can fund, manage, and execute at once. Redaptive supplies both, which is why the timeline compresses rather than simply being a goal the internal team could hit on its own. The internal rate of return improves not just because the cost of inaction is included in the model, but because the speed of execution accelerates the payback timeline. Redaptive’s portfolio approach captures substantially more value than site-by-site execution, pulling savings forward by roughly three years. On a representative multi-site program, that acceleration has been modeled to add $8.4 million in value that sequential execution would have left on the table.
For finance leaders managing capital across a large multi-site portfolio, that combination of better IRR, faster payback, predictable outcomes, and no upfront capital is what makes proactive replacement competitive with growth investments for the first time. Evaluated on net present value across the full footprint, rather than site-by-site review on simple payback, the case is stronger still.
Build the financial case for your portfolio
Every quarter of delay has a price. See the full cost curve in the Industry Guide: The True Cost of Deferring Energy Upgrades.
Run the numbers on your own portfolio with our Portfolio Advantage Estimator.