








Summary: Industrial organizations with aging facility infrastructure pay a compounding cost for every quarter they defer system and equipment replacements. Energy costs rise as equipment loses efficiency. Repair costs escalate as failure risk increases. And replacement costs climb as equipment prices continue to reach new highs. This blog explains each layer of that cost structure, quantifies it with third-party data, and makes the case that deferral is not a neutral choice. It is an active financial decision with a measurable and growing price tag.
Introduction
Most facilities and finance leaders know facility infrastructure across their footprint is aging. Far fewer can put a number on what it’s costing them to keep running it. In our work across thousands of industrial sites, that knowledge gap is the rule, not the exception
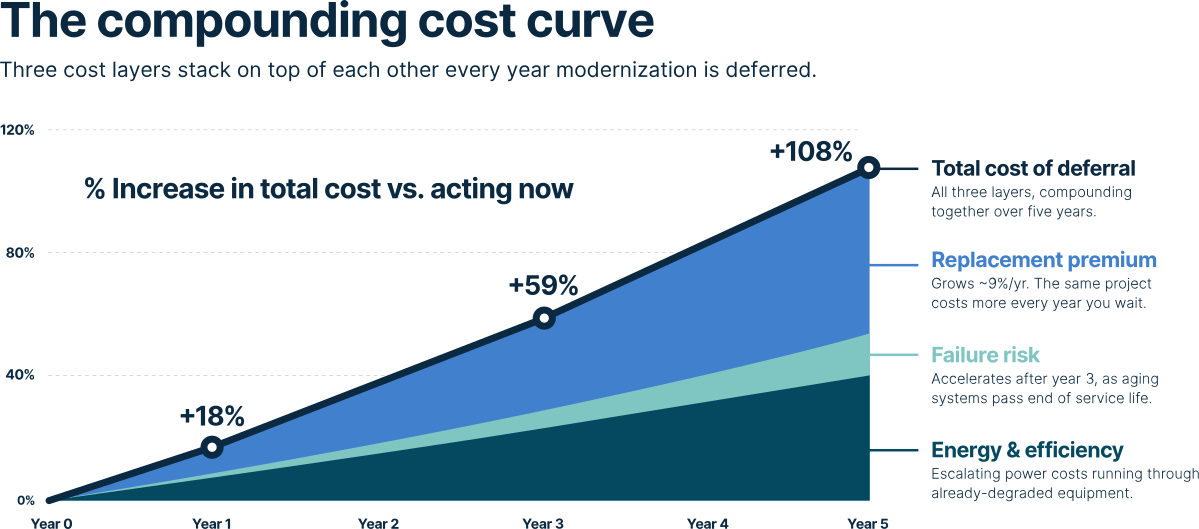
Deferring facility and energy infrastructure retrofits are not the same as pushing this year’s cost into next year’s budget. The cost doesn’t hold flat while you wait. It compounds. Each year of delay adds additional on top of the last: rising energy spend on inefficient equipment, higher repair frequency as assets approach failure, increasing rental equipment rates, and an increasingly expensive replacement project when emergency repair is required.
This blog post breaks down the Compounding Cost Curve, the three-layer cost structure that makes every quarter of deferral more expensive than the one before it, and explains why the math always resolves in the same direction: act now, or pay more later.
A widely cited facilities benchmark holds that every $1 of deferred maintenance turns into roughly $4 of future capital renewal. The Compounding Cost Curve is that same principle, quantified: the longer a replacement waits, the more the total cost of that decision grows.
-Rick Biedenweg, Pacific Partners Consulting Group.
Layer one: Rising energy costs, falling efficiency
Why does aging infrastructure cost more to run every year?
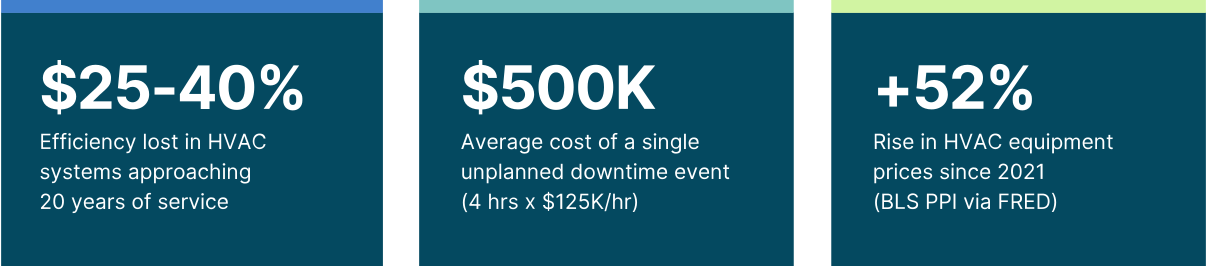
Aging facility infrastructure loses efficiency over time. HVAC and mechanical systems are among the most significant contributors to that loss and among the most data-rich. According to ASHRAE, HVAC systems approaching 20 years of service experience efficiency losses of 25 to 40 percent compared to their original performance ratings. Across a multi-site industrial portfolio, that degradation is not a marginal variance. Consider a mixed portfolio of 10 manufacturing plants, 5 distribution centers, and 2 offices. If aging HVAC and mechanical systems across those sites are running 25–40% below their original efficiency, and a single large plant can carry a seven-figure annual energy bill, the efficiency gap alone can represent millions in avoidable annual spend across the footprint. It is a structural energy burden that grows every year the equipment is not replaced.
That burden is compounded by what is happening to energy prices. The U.S. Energy Information Administration reports that industrial sector electricity prices rose 11.4 percent year-over-year as of January 2026. Post-2022, nominal electricity prices have risen at an average of 4.5 percent per year, more than six times the 0.7 percent annual growth rate from 2013 to 2020. An organization running aging equipment is not paying a fixed premium. It is paying an escalating one, on a baseline that is itself escalating.
DOE and ASHRAE data documents that modern high-efficiency HVAC equipment uses 30%-50% less energy than comparable equipment installed 15 to 20 years ago. The same dynamic applies across mechanical systems, lighting, and controls: every category of aging facility infrastructure. Every year that work is delayed is a year of paying the premium between current performance and what modern systems would deliver, at energy rates that continue to rise.
Apply that escalation across the multi-site portfolio above. The avoidable energy spend from aging infrastructure is never a fixed figure. A performance gap that costs several million this year costs more next year, and more again the year after.
An organization running aging equipment is not paying a fixed premium. It is paying an escalating one, on a baseline that is itself escalating.
Layer two: The repair spiral
What does aging equipment failure actually cost industrial operations?
Aging infrastructure does not fail suddenly. It degrades. Repair frequency increases. Emergency maintenance events have become more common. And then, at some point, something fails completely, impacting production, costs, and revenue.
According to Plant Engineering’s 2021 Maintenance Study, over 60% of unplanned industrial failures are attributable to aging assets and mechanical failures, the leading cause category by a significant margin. The same study found that 52% of industrial facilities still use run-to-fail approaches to HVAC and mechanical equipment, a pattern that extends across facility infrastructure broadly. Not because the risk is unknown, but because the internal capital approval process for proactive replacement consistently loses urgency the moment nothing has visibly failed yet.
Reactive maintenance isn’t free. The DOE has quantified how expensive it actually is. According to the Department of Energy’s Operations and Maintenance Best Practices Guide, moving from reactive maintenance to a structured preventive program reduces maintenance costs by up to 12%-18%. Facilities that use predictive, condition-based maintenance can reach total potential savings of 30 to 40% versus running to failure. Reactive operation is not the neutral baseline it appears to be on a budget line. It is the most expensive maintenance strategy available, and the gap widens the longer aging equipment stays in service.
The cost of those failures is well-documented. ABB’s Value of Reliability Survey, which surveyed more than 3,200 global plant maintenance leaders, found that two-thirds of industrial companies experience unplanned downtime at least once a month, at an average cost of $125,000 per hour. The average unplanned downtime event lasts four hours. That is a $500,000 incident from equipment that, in most cases, could have been identified as at risk and replaced under a planned program at a fraction of that cost.
The operational stakes vary by facility type and system. Heaving and cooling system failures in a manufacturing environment are not simply an occupant comfort issue. It can mean a production environment outside process temperature tolerances, triggering a line shutdown. A mechanical system failure in a distribution or logistics operation can mean cold chain interruption, service level agreement violations, and customer penalties that far exceed the cost of the equipment itself. Across facility types, any critical system failure in heating and cooling, mechanical, electrical distribution, or controls can cascade quickly into production loss or revenue impact. The Siemens True Cost of Downtime report found that the world’s 500 largest companies lose approximately $1.4 trillion annually to unplanned downtime, equivalent to 11 percent of total revenues, up 62 percent from 2019.
Deferred maintenance does not reduce this risk. It concentrates it in older equipment, with higher failure probability, in facilities where the operational stakes are highest.
Two-thirds of industrial companies experience unplanned downtime at least once a month. The average event lasts four hours. At $125,000 per hour, that is a $500,000 incident.
Layer three: The replacement cost premium
Newer equipment is more efficient than ever. It’s also more expensive than ever.
Newer equipment is more efficient than what it’s replacing. It is also more expensive than it has ever been. The BLS Producer Price Index for HVAC and commercial refrigeration equipment, tracked by the Federal Reserve via FRED, shows prices up roughly 52 percent since early 2021. The index hit an all-time high in April 2026. HVAC and mechanical are the most data-rich categories, but equipment cost inflation is not unique to them. It reflects broader supply chain, labor, and materials pressures across the facility infrastructure market. Since 2021, every major commercial HVAC manufacturer including Carrier, Trane, Daikin, and Lennox has announced multiple rounds of price increases annually, typically ranging from 4 to 14 percent per announcement.
The cost of the deferred project keeps climbing as equipment price indexes reach new highs. But the more significant burden is the compounding price an organization pays while waiting: escalating energy spend on inefficient systems, emergency maintenance premiums triggered by asset failure, and lost output when degraded infrastructure constrains production. By the time modernization is finally executed, the organization has already paid the full price of that operational gap, on top of an increasingly expensive replacement project.
Why the blacklog never clears
Why can’t a facilities team get ahead of infrastructure replacement on its own?
The cost of deferral compounds for a reason that has nothing to do with whether the work is warranted and everything to do with how capital budgets are allocated. Most facilities teams already know which systems are at risk. The replacement list exists. What does not exist is the capacity to execute against it: the capital approved fast enough, the crews available across every site, the program management to run dozens of projects in parallel without pulling the internal team off the work of keeping the plant running. So the list becomes a backlog, and the backlog grows faster than it can be cleared. Each year, more systems age into the at-risk category than the team can replace, and the gap between what needs doing and what gets done widens, which is the same gap the Compounding Cost Curve prices out.
This is the constraint a portfolio program is built to remove. The limit on how fast infrastructure gets modernized was never only capital. It was delivery capacity: how many projects an organization can fund, manage, and execute at once without disrupting operations. A portfolio approach lifts both ceilings at the same time. Redaptive funds the work and brings the resources to execute across the entire portfolio in parallel, so the pace of modernization is set by the condition of the equipment, not by what an internal team can absorb in a single budget cycle.
The difference shows up in the timeline. Work that would take an internal team five years to sequence site by site can be executed across the portfolio in a fraction of that time, because the projects run simultaneously rather than waiting in line for the next budget approval and the next available crew. For a facilities leader, that is the difference between staying permanently behind the failure curve and finally getting in front of it. The backlog stops being a backlog. It becomes a program with an end date.
A portfolio program doesn’t replace systems one failure at a time. It clears them on a schedule you set, years faster than you could alone.
What the math adds up to
How do industrial organizations build a business case for proactive infrastructure replacement?
The Compounding Cost Curve reframes the capital allocation question. Infrastructure projects typically lose the internal comparison to growth investments because the model omits the true cost of inaction: rising energy costs running on inefficient equipment, escalating repair spend, growing failure exposure, lost output when degraded systems constrain production, and a replacement cost premium that accumulates every year the project is deferred.
When those costs are included in the model, the question is not whether infrastructure modernization competes with growth investments. It is whether the organization can afford to keep paying the compounding cost of deferral while the project gets more expensive to execute.
The answer depends on the age and condition of equipment across the portfolio, the energy intensity of the facilities involved, and the operational consequences of a failure event at any individual site. But the direction of the math does not change. Deferral compounds. The cost of acting now is lower than the cost of acting later, and the gap between the two widens every year.
A portfolio approach to infrastructure modernization, one that assesses conditions and failure exposure across all facilities, funds the work without competing with core capital priorities, and executes with minimal operational disruption, is the mechanism for getting in front of that curve rather than chasing it.
The less obvious benefit is what a proactive program gives back: certainty. Energy spend becomes predictable. Failure risk becomes manageable. The budget is no longer set by aging equipment and unplanned events. Organizations that move from reactive to programmatic get cost reduction, but they also get control — and for finance leaders managing capital across a large portfolio, that predictability is often the more durable value.
In reactive mode, unplanned failures set the budget. A proactive portfolio strategy makes costs predictable and brings total operating costs down.
Whats the delay costing you?
Every quarter of delay has a price. See the full cost curve in the Industry Guide: The True Cost of Deferring Energy Upgrades.
Run the numbers on your own portfolio with our Portfolio Advantage Estimator.