Inflation raced to a 41-year high in June, dashing hopes that it might be slowing down. The primary reasons: rising petroleum, natural gas, and gasoline prices, which are still pedal to the metal.
Are electric rates seeing similar spikes? The answer is an overwhelming yes.
Corporate energy managers and finance teams are seeing their electric rates rise dramatically. However, some are being hit harder than others. Increased energy costs will depend on several factors, including the state you’re in, your electric utility, your consumption characteristics, and the rate tariff for each of your facilities.
Rather than analyze all the various scenarios across the United States, I’ll simplify, by providing state-level observations of the “average annual” electric rates for both commercial and industrial electric users.
Cost Components of Energy Rates
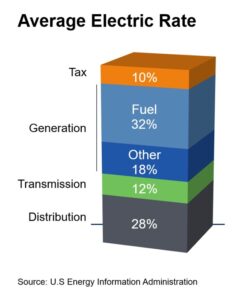 Before I share the average rate observations, it’s important to understand the typical cost components that are included in electric rates. Generically speaking, the average electric rate will vary state by state based on renewable energy infrastructure and access , the condition of electric distribution and transmission systems, and government taxes.
The generation component in this graphic includes investment in long-term generation assets combined with fuel costs. Today, of course, fossil fuels still play a dominant role in electric rates. However, it should be noted that fuel costs only affect 32% of the average electric rate and these costs are almost always hedged across a longer period. That helps explain why average electric rates are not as immediately impacted by real-time market fluctuations in fossil fuels.
Average Annual Electric Rates
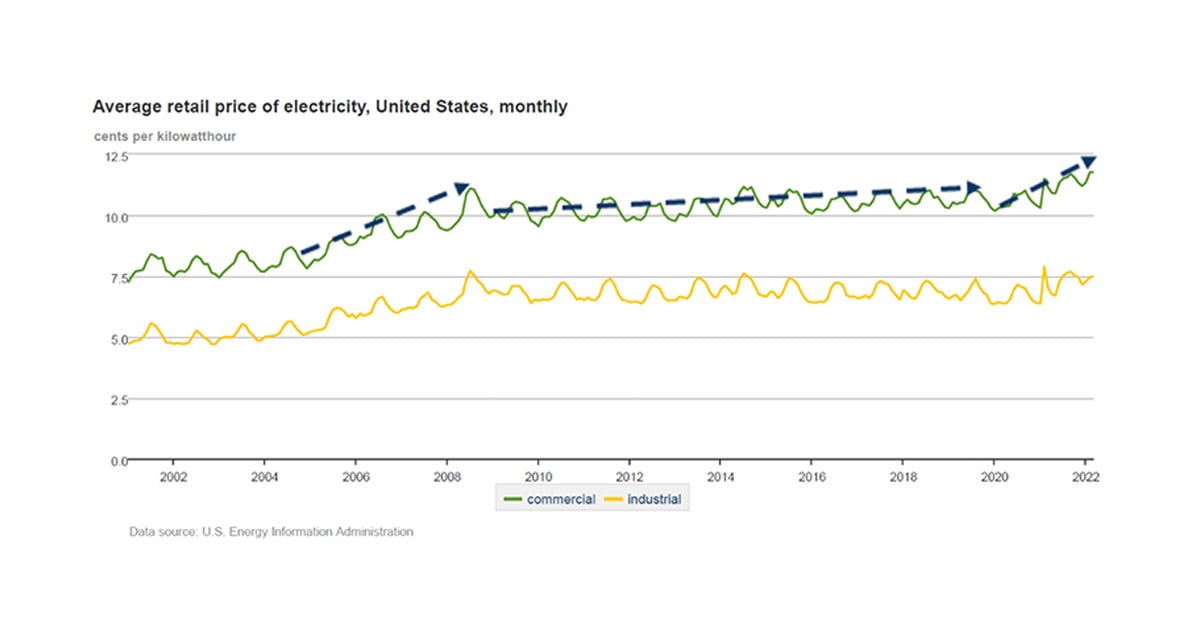
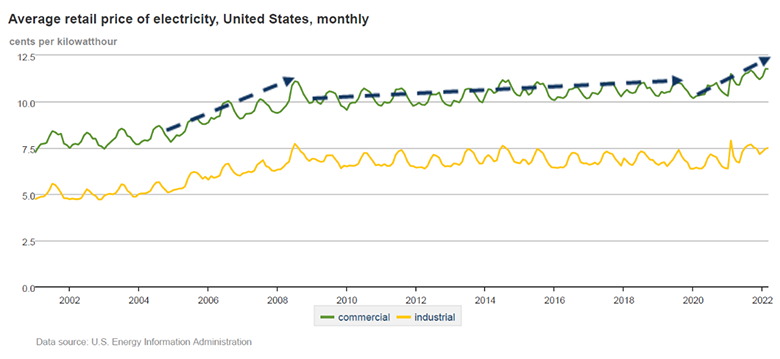
The Department of Energy (DOE) is an excellent source for understanding electric rate trends for each state. These rates are based on actual conditions seen at facilities across the country. In addition, the DOE provides both short-term and long-term forecasts, which take into consideration industry trends that may affect fossil fuel costs as well as changes in labor, materials and services.
Based on the DOE data, the national annual average electric rates for the most recent month available are:
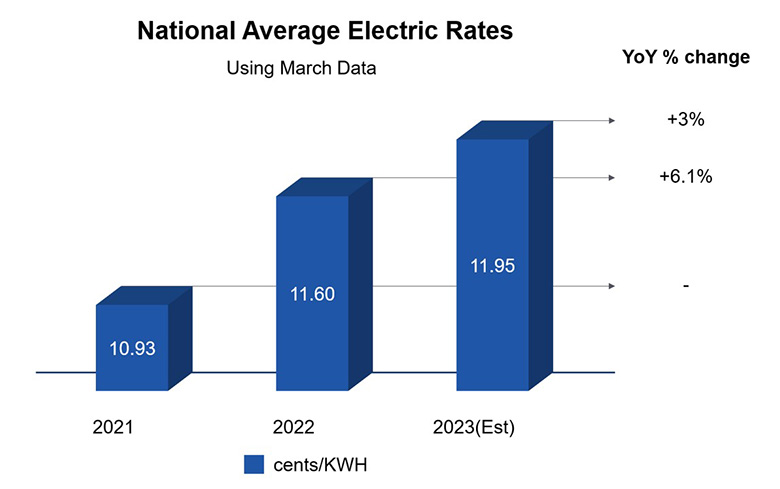
This graph highlights the severe negative impact that the pandemic and international issues have had on national electric rates from 2021 to 2022, primarily driven by regional consumption trends and fuel cost increases. Indeed, the U.S has not seen this level of electric rate increase since the Great Recession of 2008.
On the bright side, however, current forecasts are now indicating that the YOY electric rate changes going into 2023 may be less severe. This is due to the post-pandemic normalization of electric consumption and the absorbed cost of fossil fuel rate increases.
State-by-State Average Electric Rates
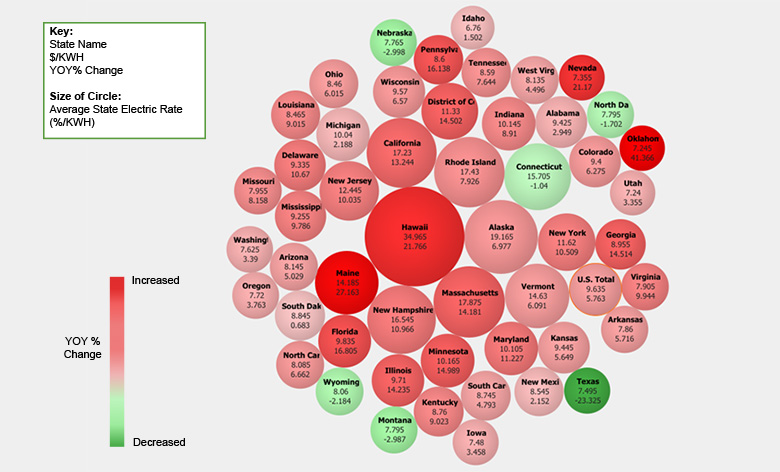
The next graphic provides an understanding of the average electric rate for each state (size of circle) and the YOY percentage change in electric rates (color of circle).
The graphic shows that average rates have gone up radically in most states. And they will continue their upward trajectory, even as energy prices become more volatile. This means companies of all sizes will have to get smart about how they consume electricity. After all, businesses can’t control their electricity rates, but they can control their energy consumption. These trends are based on many factors and may be single issue corrections, such as with Texas. To be fully accurate, a detailed analysis should be performed on a specific list of facilities to completely understand any special conditions that apply.
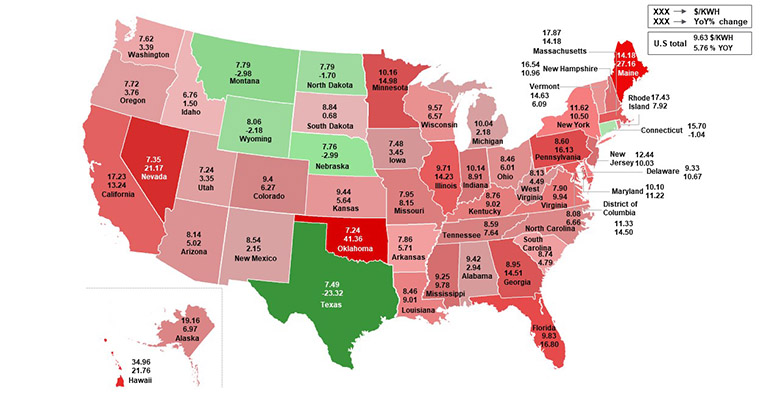
STATE 2022 AVERAGE ELECTRIC RATE vs YOY % CHANGE
The following graph showcases the same information as states on the map. The darker colors indicate a more dramatic YOY% Change.
The Rise of Energy-as-a-Service
With inflation now at 40-year highs, there has never been a better time for businesses to implement energy-efficiency measures. One of those measures is Energy-as-a-Service (EaaS), a simple solution that companies can leverage to improve their portfolio energy management.
The EaaS model allows for the installation of an energy system, such as solar, at little to no cost. Through an EaaS model, companies can fund a variety of energy-saving retrofits for their buildings and pay through a service model instead of paying for the retrofits outright. These service payments are based on actual energy savings, resulting in an immediate reduction in operating expenses.